Assignment
This week's assignment was to create a capacitive sensor whose output could be measured using a table or graph.
Materials and Software Used
Arduino Uno, capacitors and resistors, piezoelectric, servo motor
Background
Sensors can be used in a multitude of ways to receive information about their environment. Their mechanism of data collection also varies including those based on voltage dividers or electric fields, as well as those that create a voltage and sense motion and position. Examples of voltage dividers include buttons, potentiometers, phototransistors/photoresistors, thermistors, and hall sensors. Sensors based on electric fields use the properties of capacitance to detect the proximity of objects that create changes in the electrical field.
Capacitive Touch Sensor
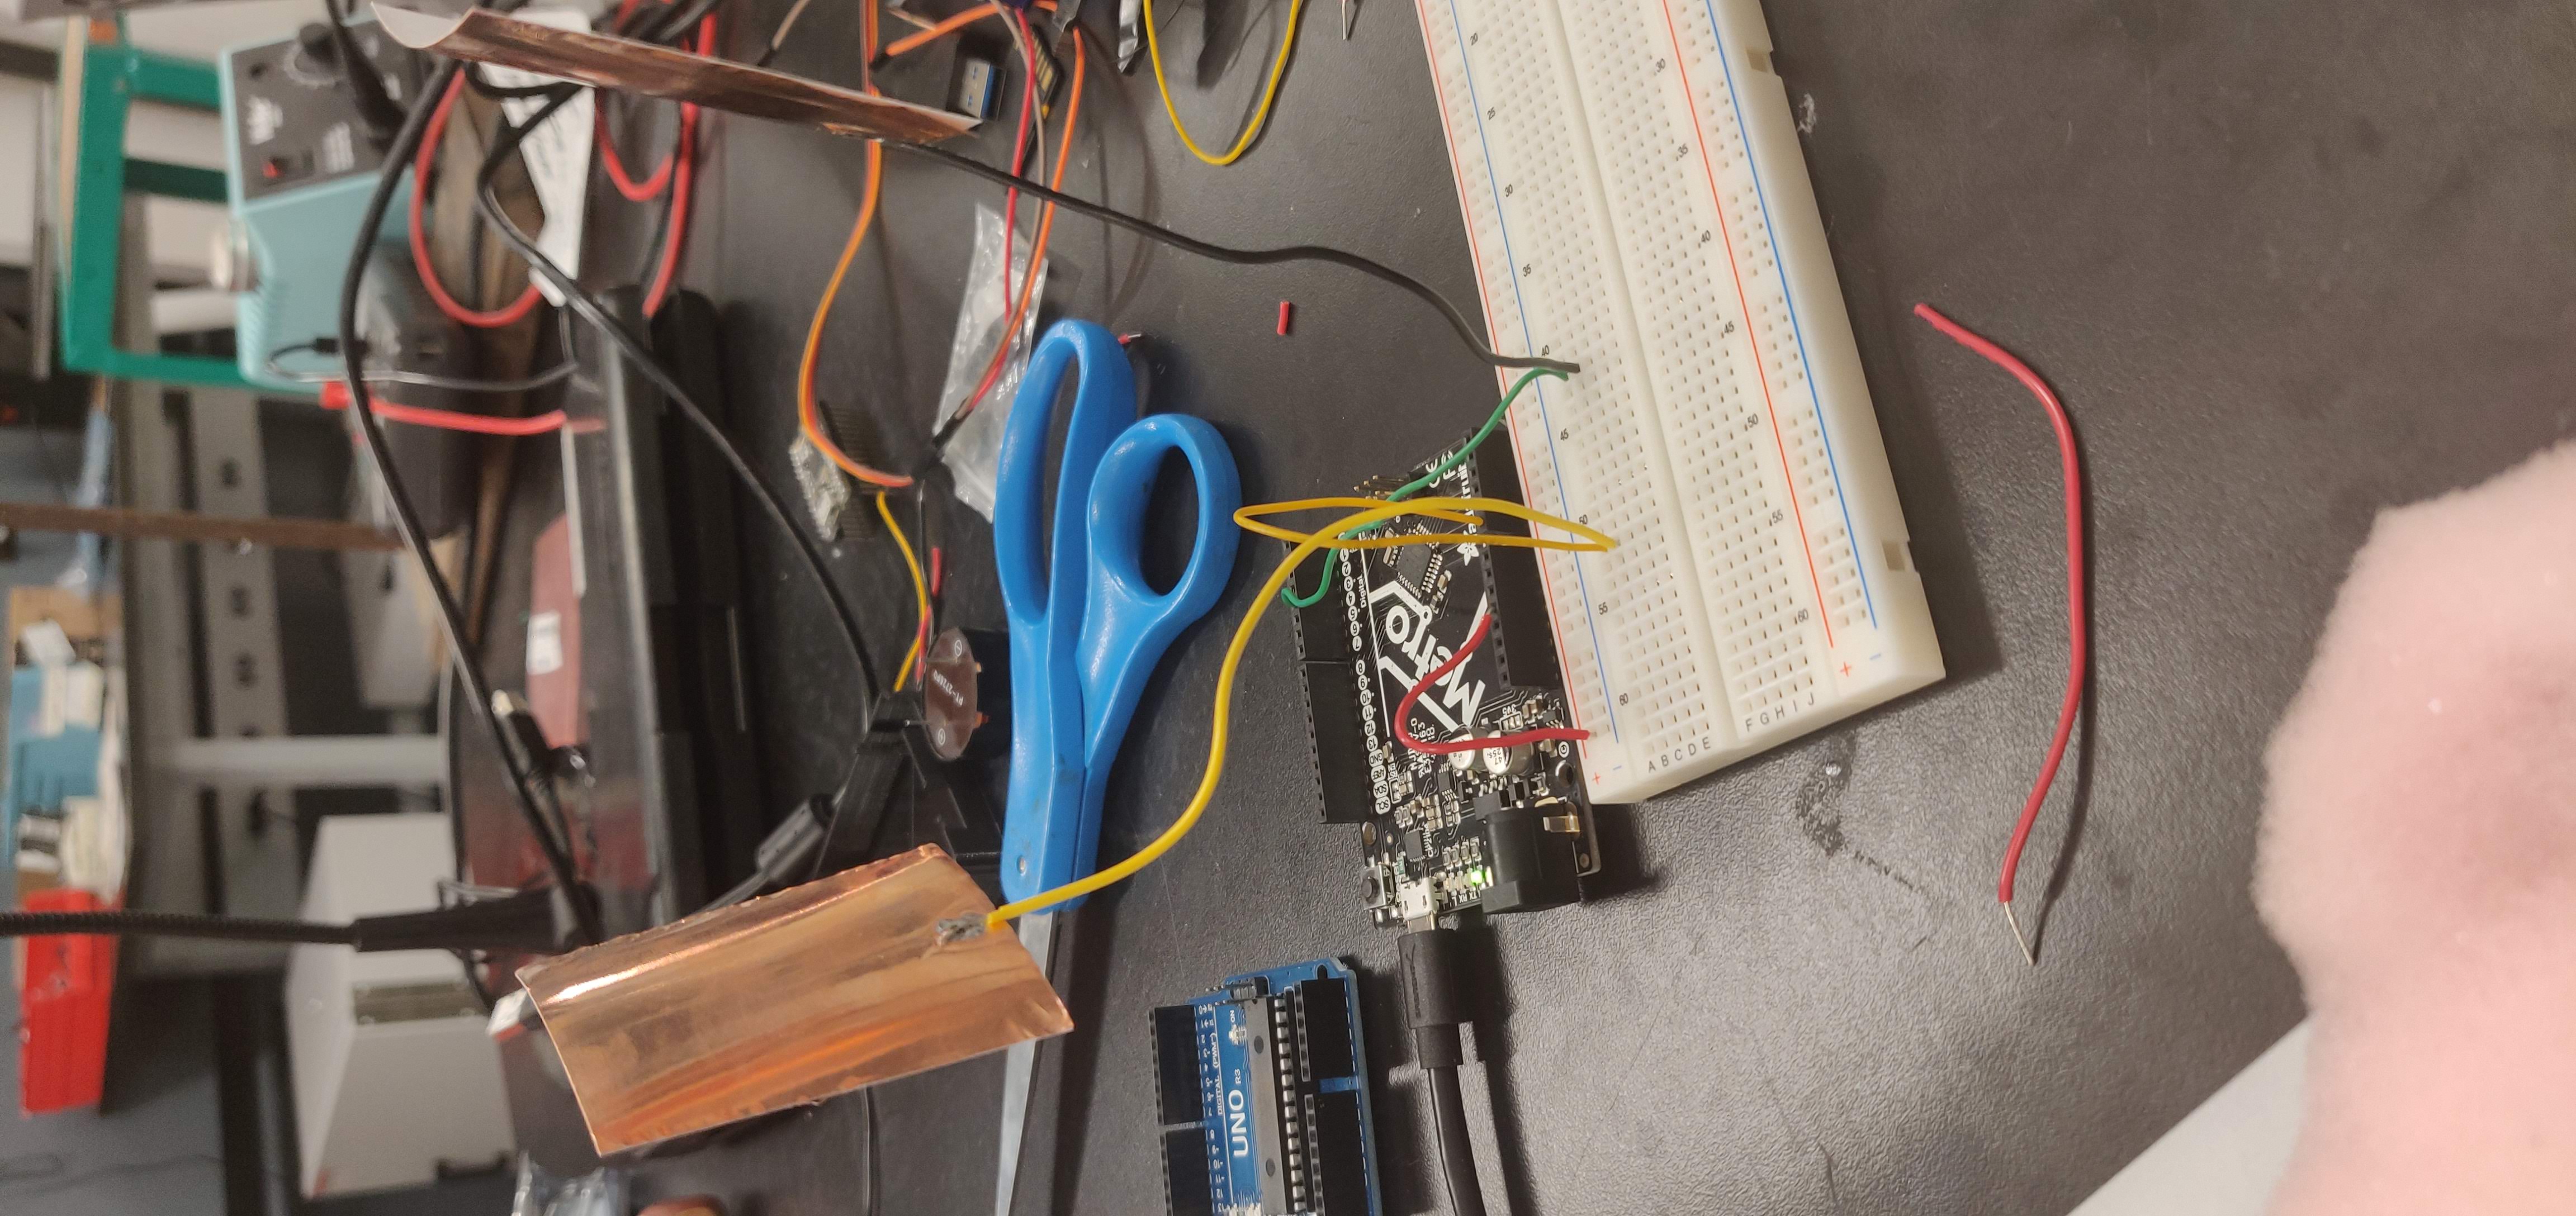
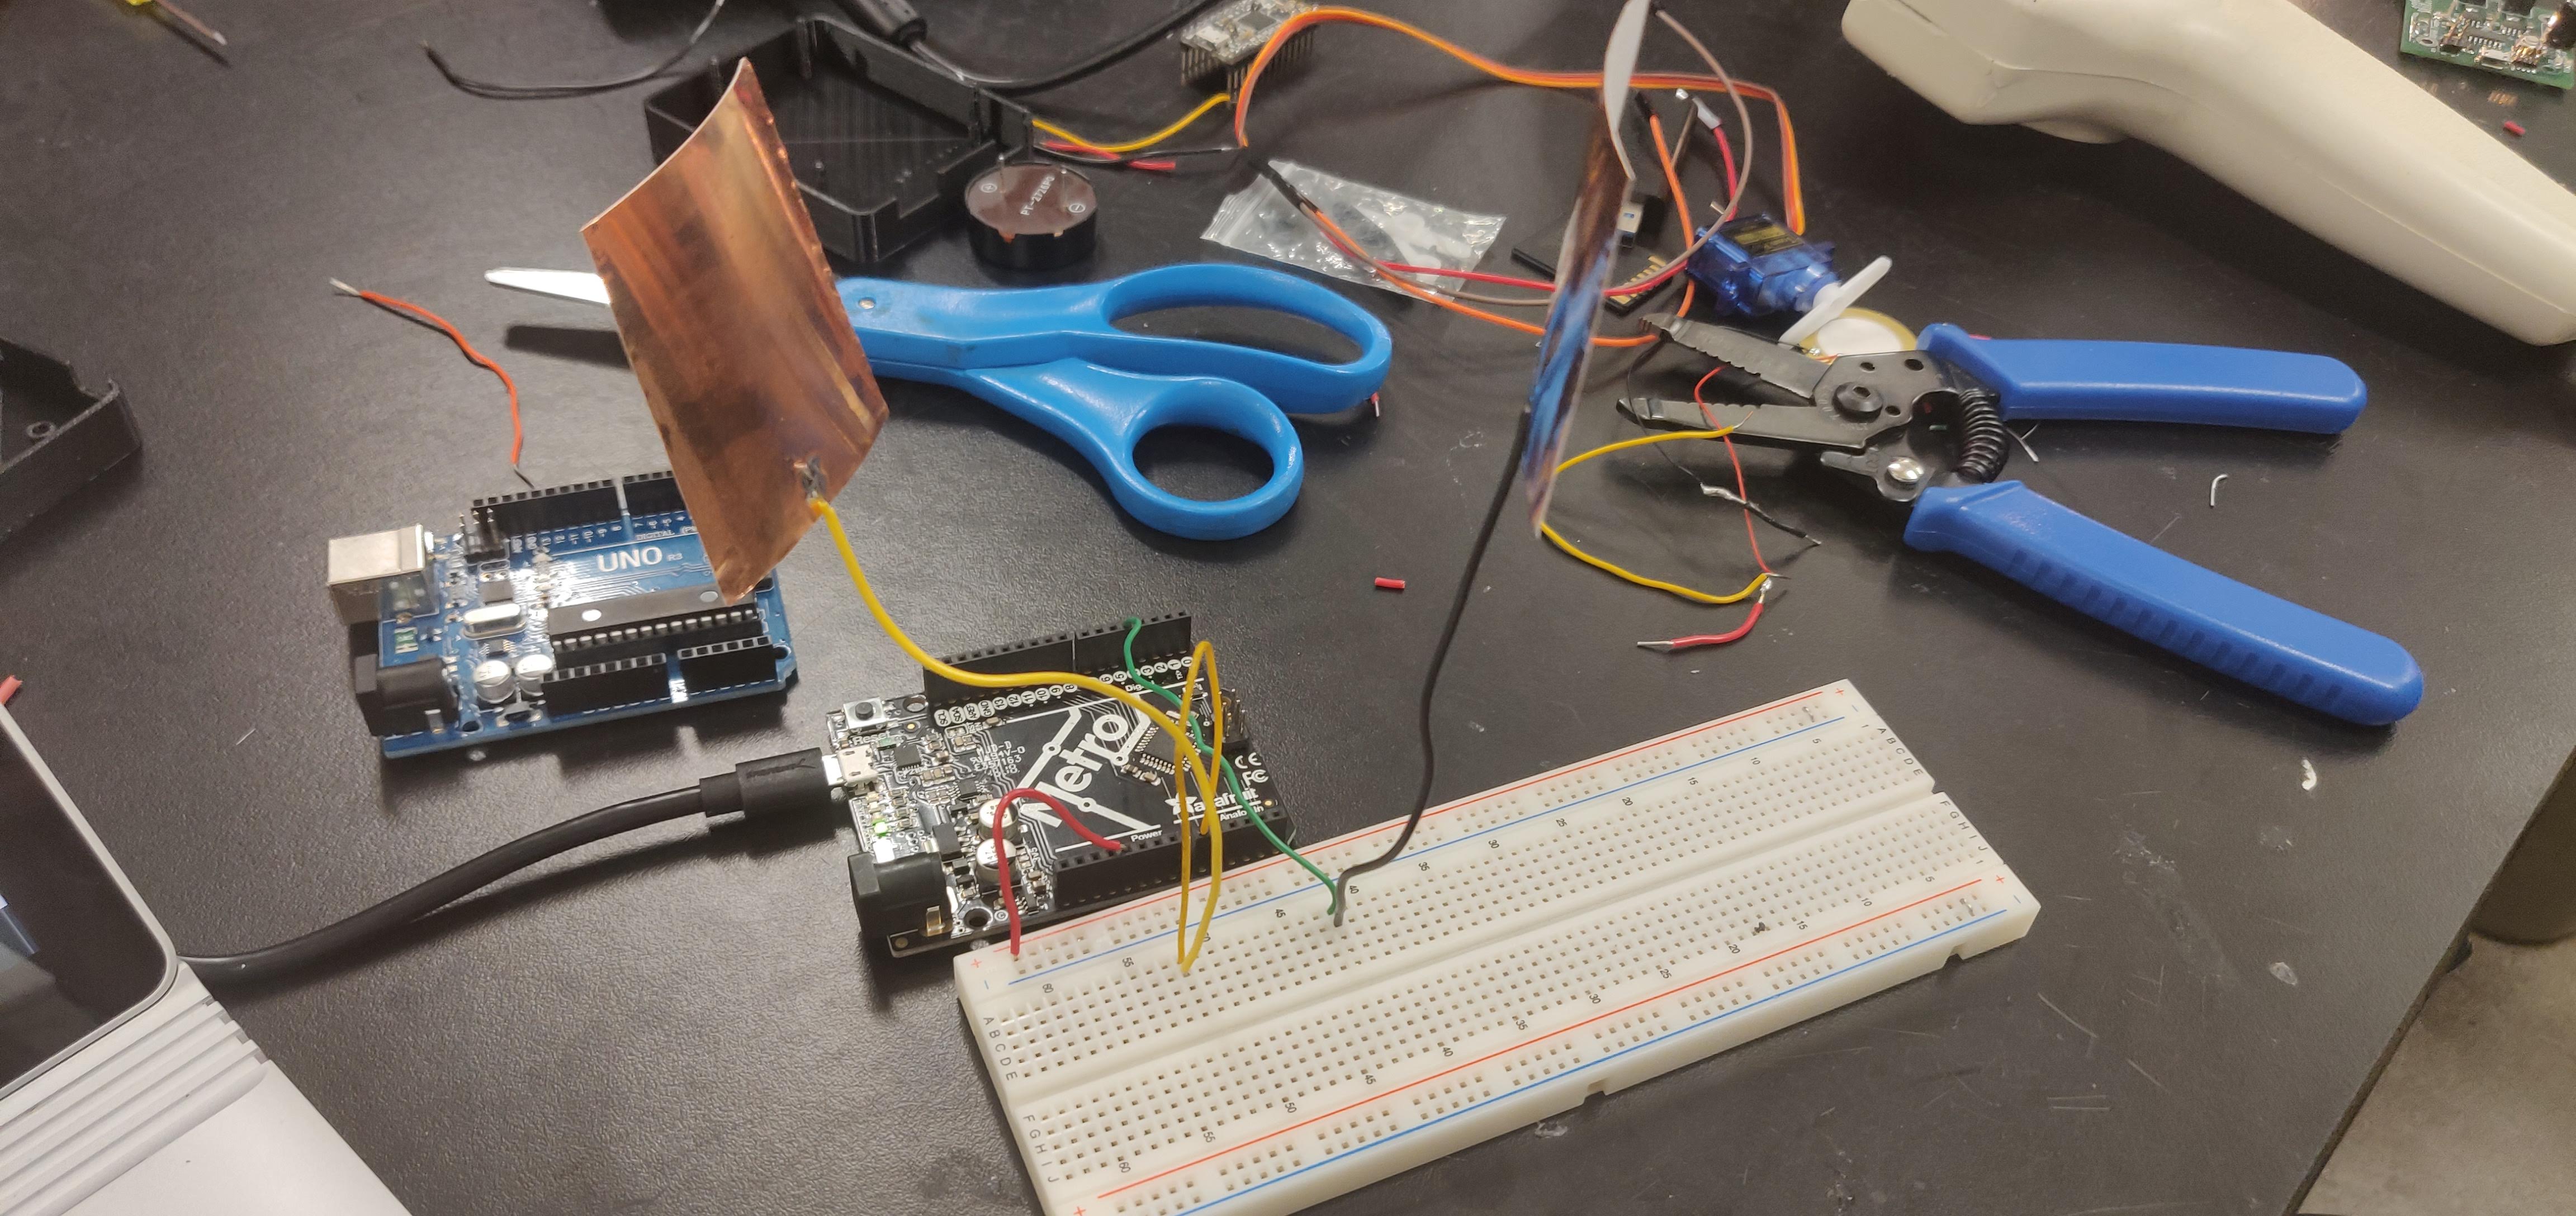
During class, we created our own capacitive touch sensor using copper tape soldered onto a wire hooked up to the Adafruit Metro, which is comparable to the Arduino Uno. As the video shows, an increase in the signal resulted when the distance between our hand and the capacitor decreased. The signal peaked when the copper tape came in contact with an object.
This was a rather simple sensor but quite effective in acquiring information on the surrounding environment!
Capacitive Force Sensor
After consulting with Rob on how to approach this one, it was clear to how a position-based capacitive force sensor can be made with just two copper tapes and an Ardunio board.
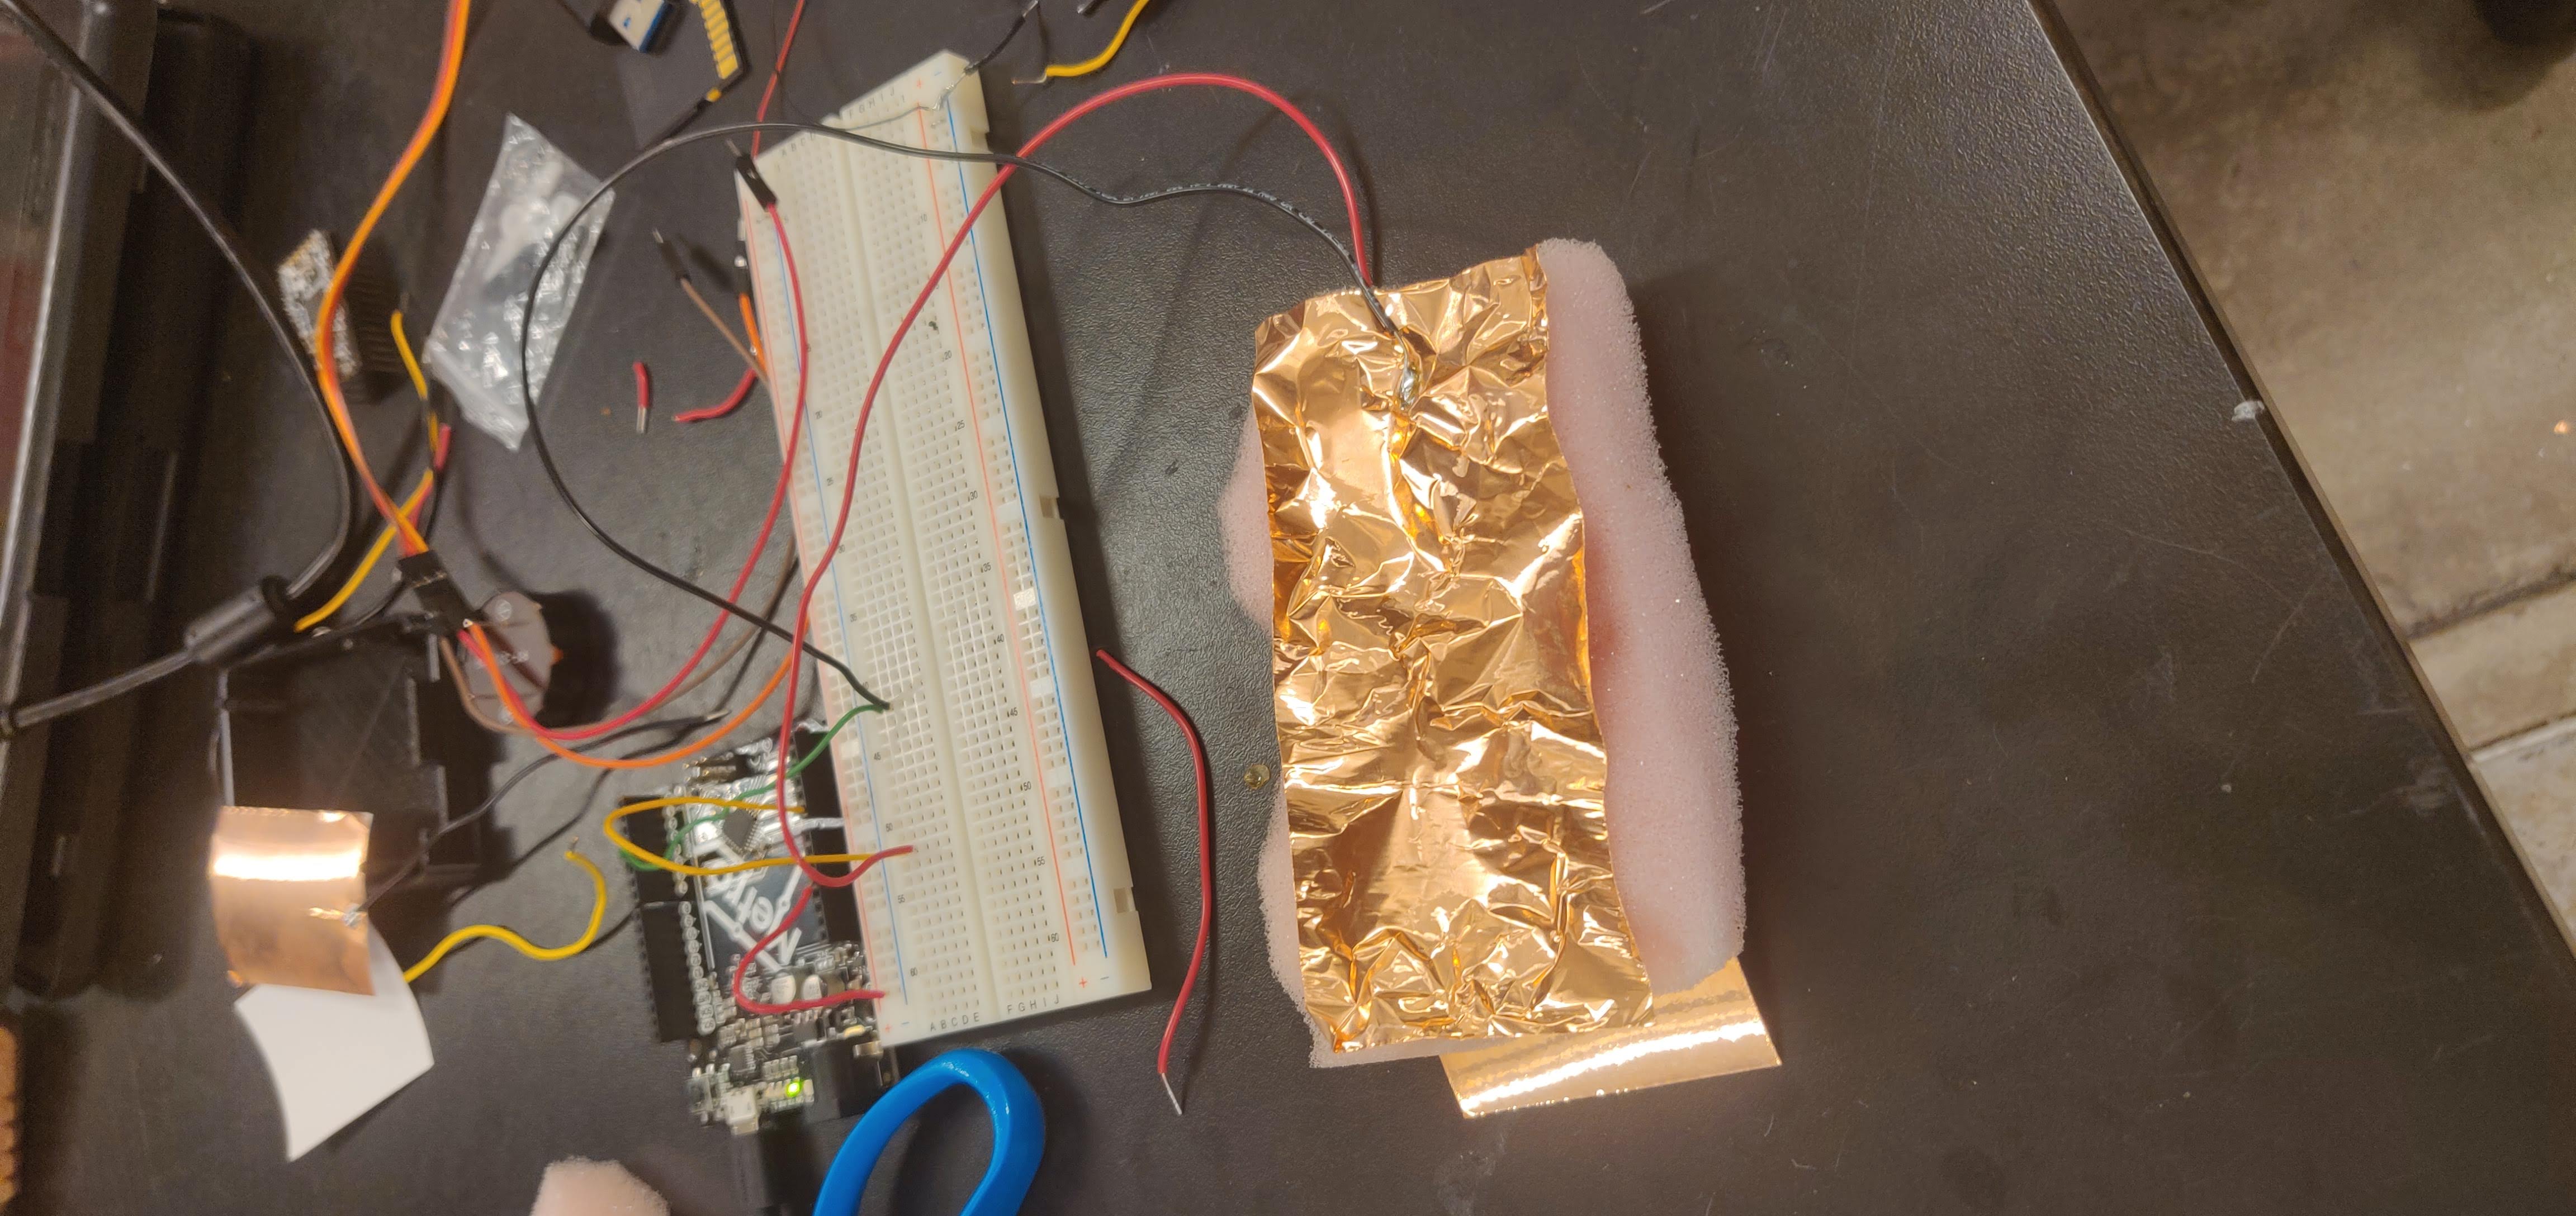
I first cut out two 5 inch sheets of copper tape and soldered on a wire onto each to connect into the breadboard. I then obtained a 5 inch piece of foam and stuck each sheet of copper tape on either side of the foam. This was followed by some simiple wiring -- one of the wires connected to an analog pin and another to the digital pin for digital output (as can be seen in the plotter and the table produced).
The values outputted from the force sensor were a bit ambiguous -- the max went to about 360 which leads to me believe that might have been some scaled form of the Newton unit. As can be seen in the video, the cyclical graph resulted from pressing onto the sensor in a periodic fashion, which shows the sensor's high degree of sensitivity and fast response time.
The calibration was a bit difficult at first as there was always some noise at the onset of data collection. In cases such as these, it is important to be able to filter errors that result from either the inherent properties of the device or background noise that the sensor could be picking up. Filtering techniques often identify the frequency of the consistent source of noise and allow these frequencies to pass through (i.e. low pass/high pass/bandwith filters).
Just for Fun
I am currently working in a lab that uses similar sensing techniques (although of high quality) to measure the amount of force generated by a subject called in for a walking study. Called ground reaction force, or GRF, these help in segmenting the gait cycle of the subject which can give us information on the kinematics of ankle plantarflexion and dorsiflexion.
I didn't have a bluetooth module with me so I simply ended up extending the length of the wires soldered onto the copper tape and placed the foam and tape unit inside my shoe to measure the amount of force generated by my own gait. The plotter showed a lot of noise that made it a little difficult to read the graph but overall, the sensor did a pretty good job in demonstrating the the cyclical nature of the magnitude of force generated during walking.
Unfortunately, I was not able to record the clear cut graphs produced, but it was very much comparable to the graph above (this was taken on a table). The max force produced went up to the 500s; the average for a person weighing 150lbs should be upwards of 2000N. Questionable measurements indeed.
Let's Move
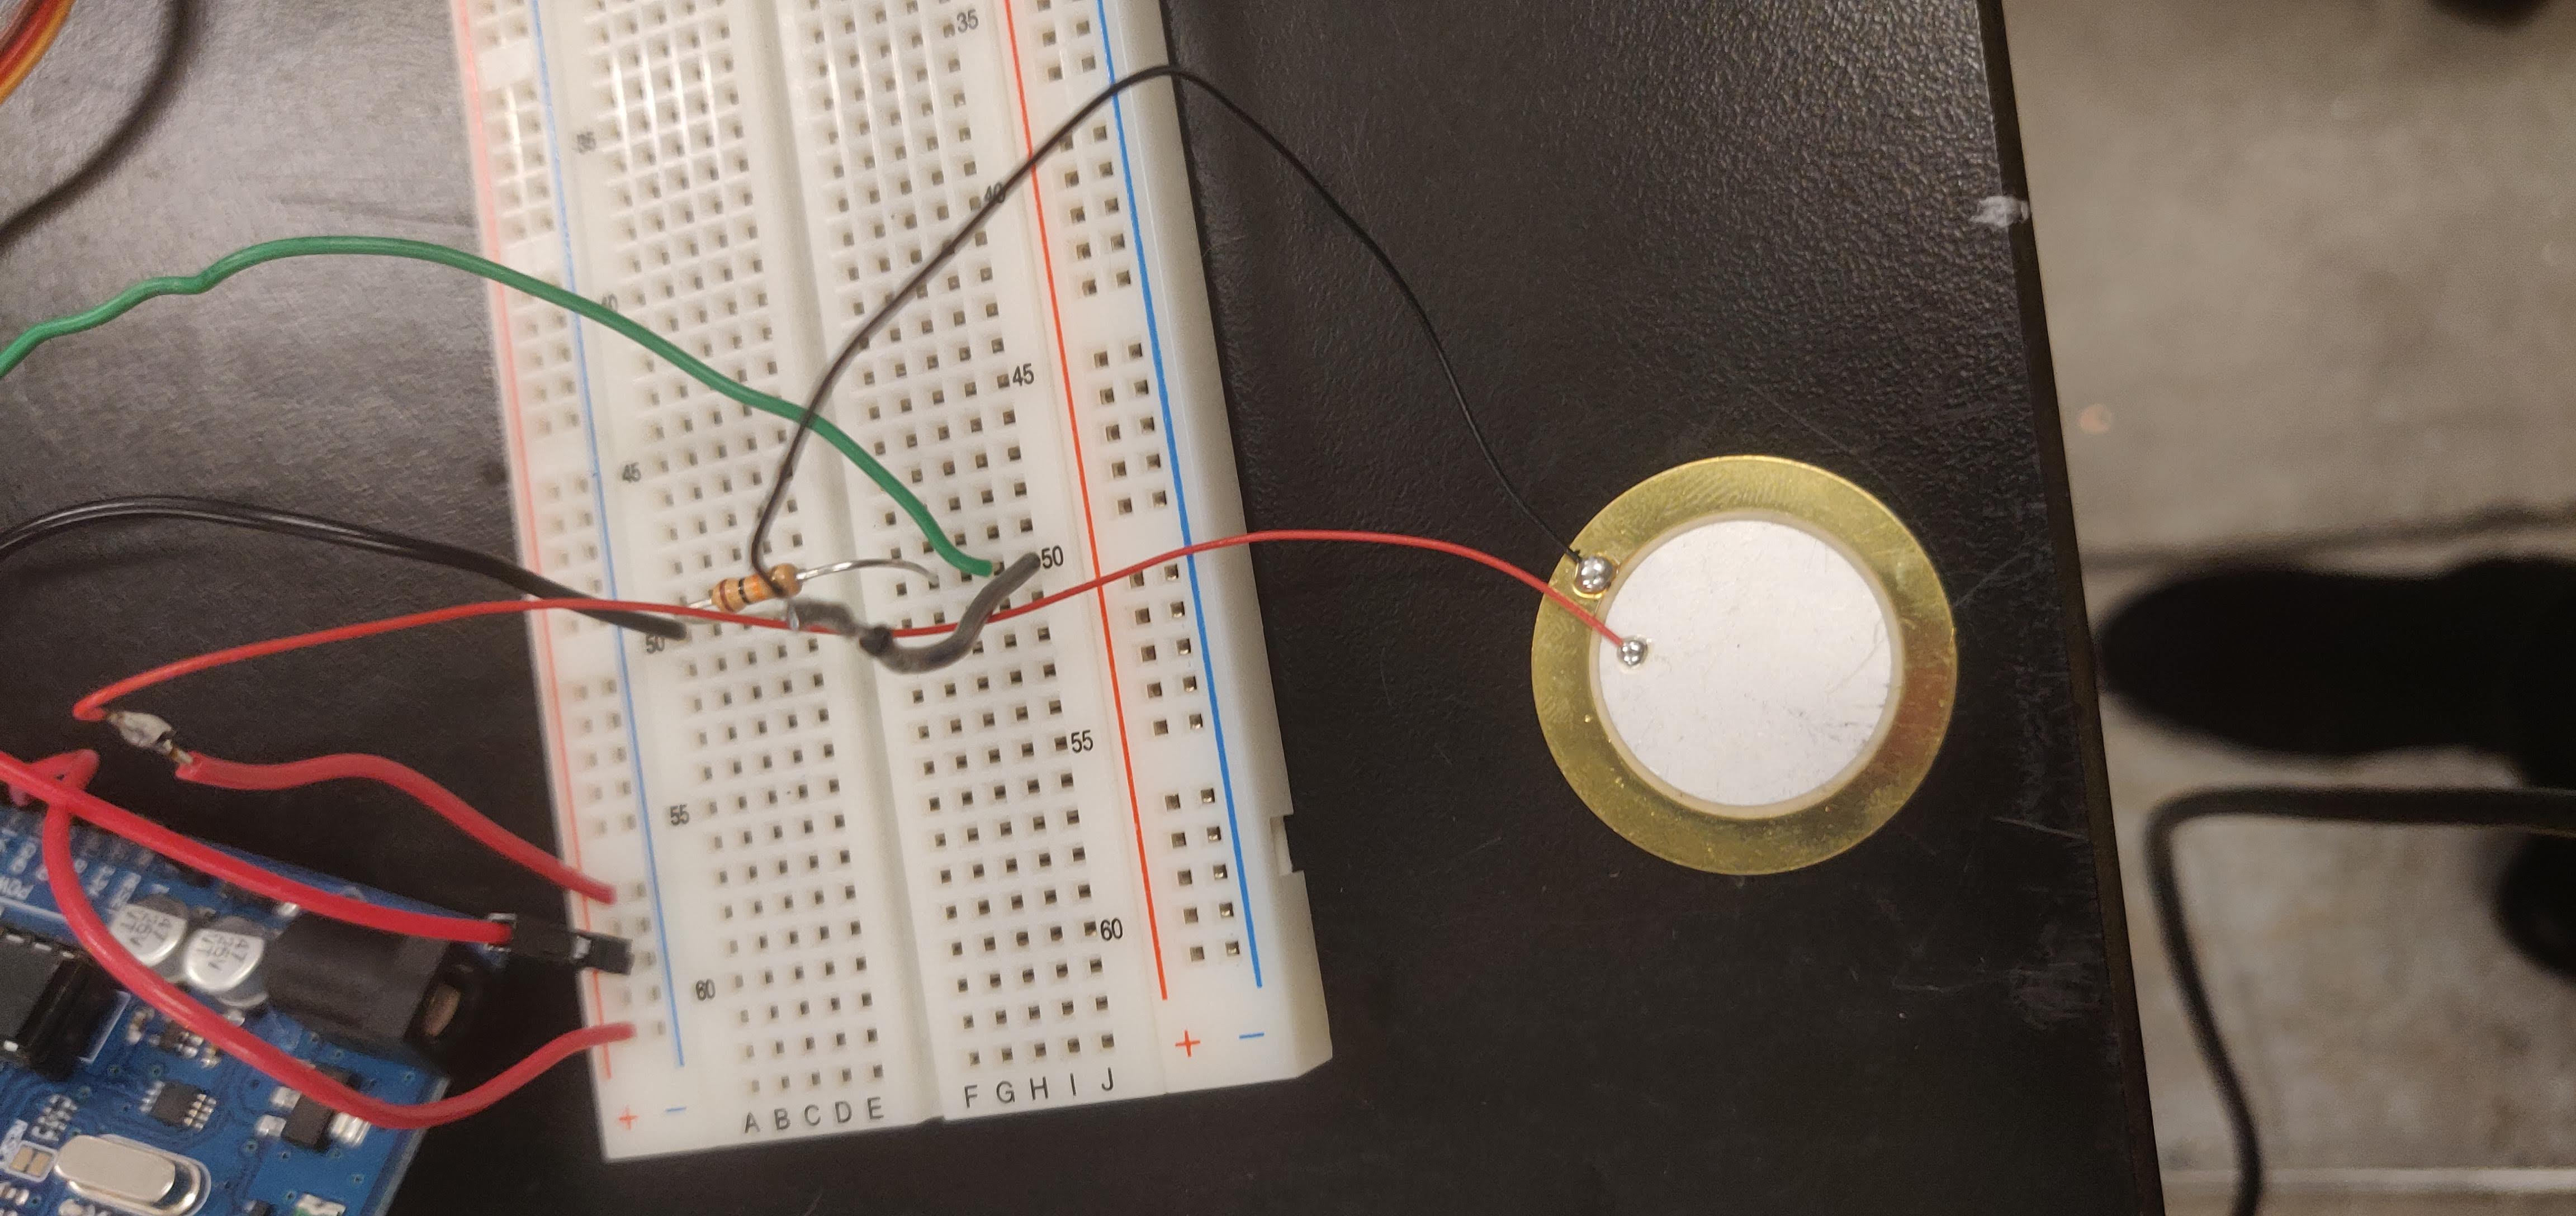
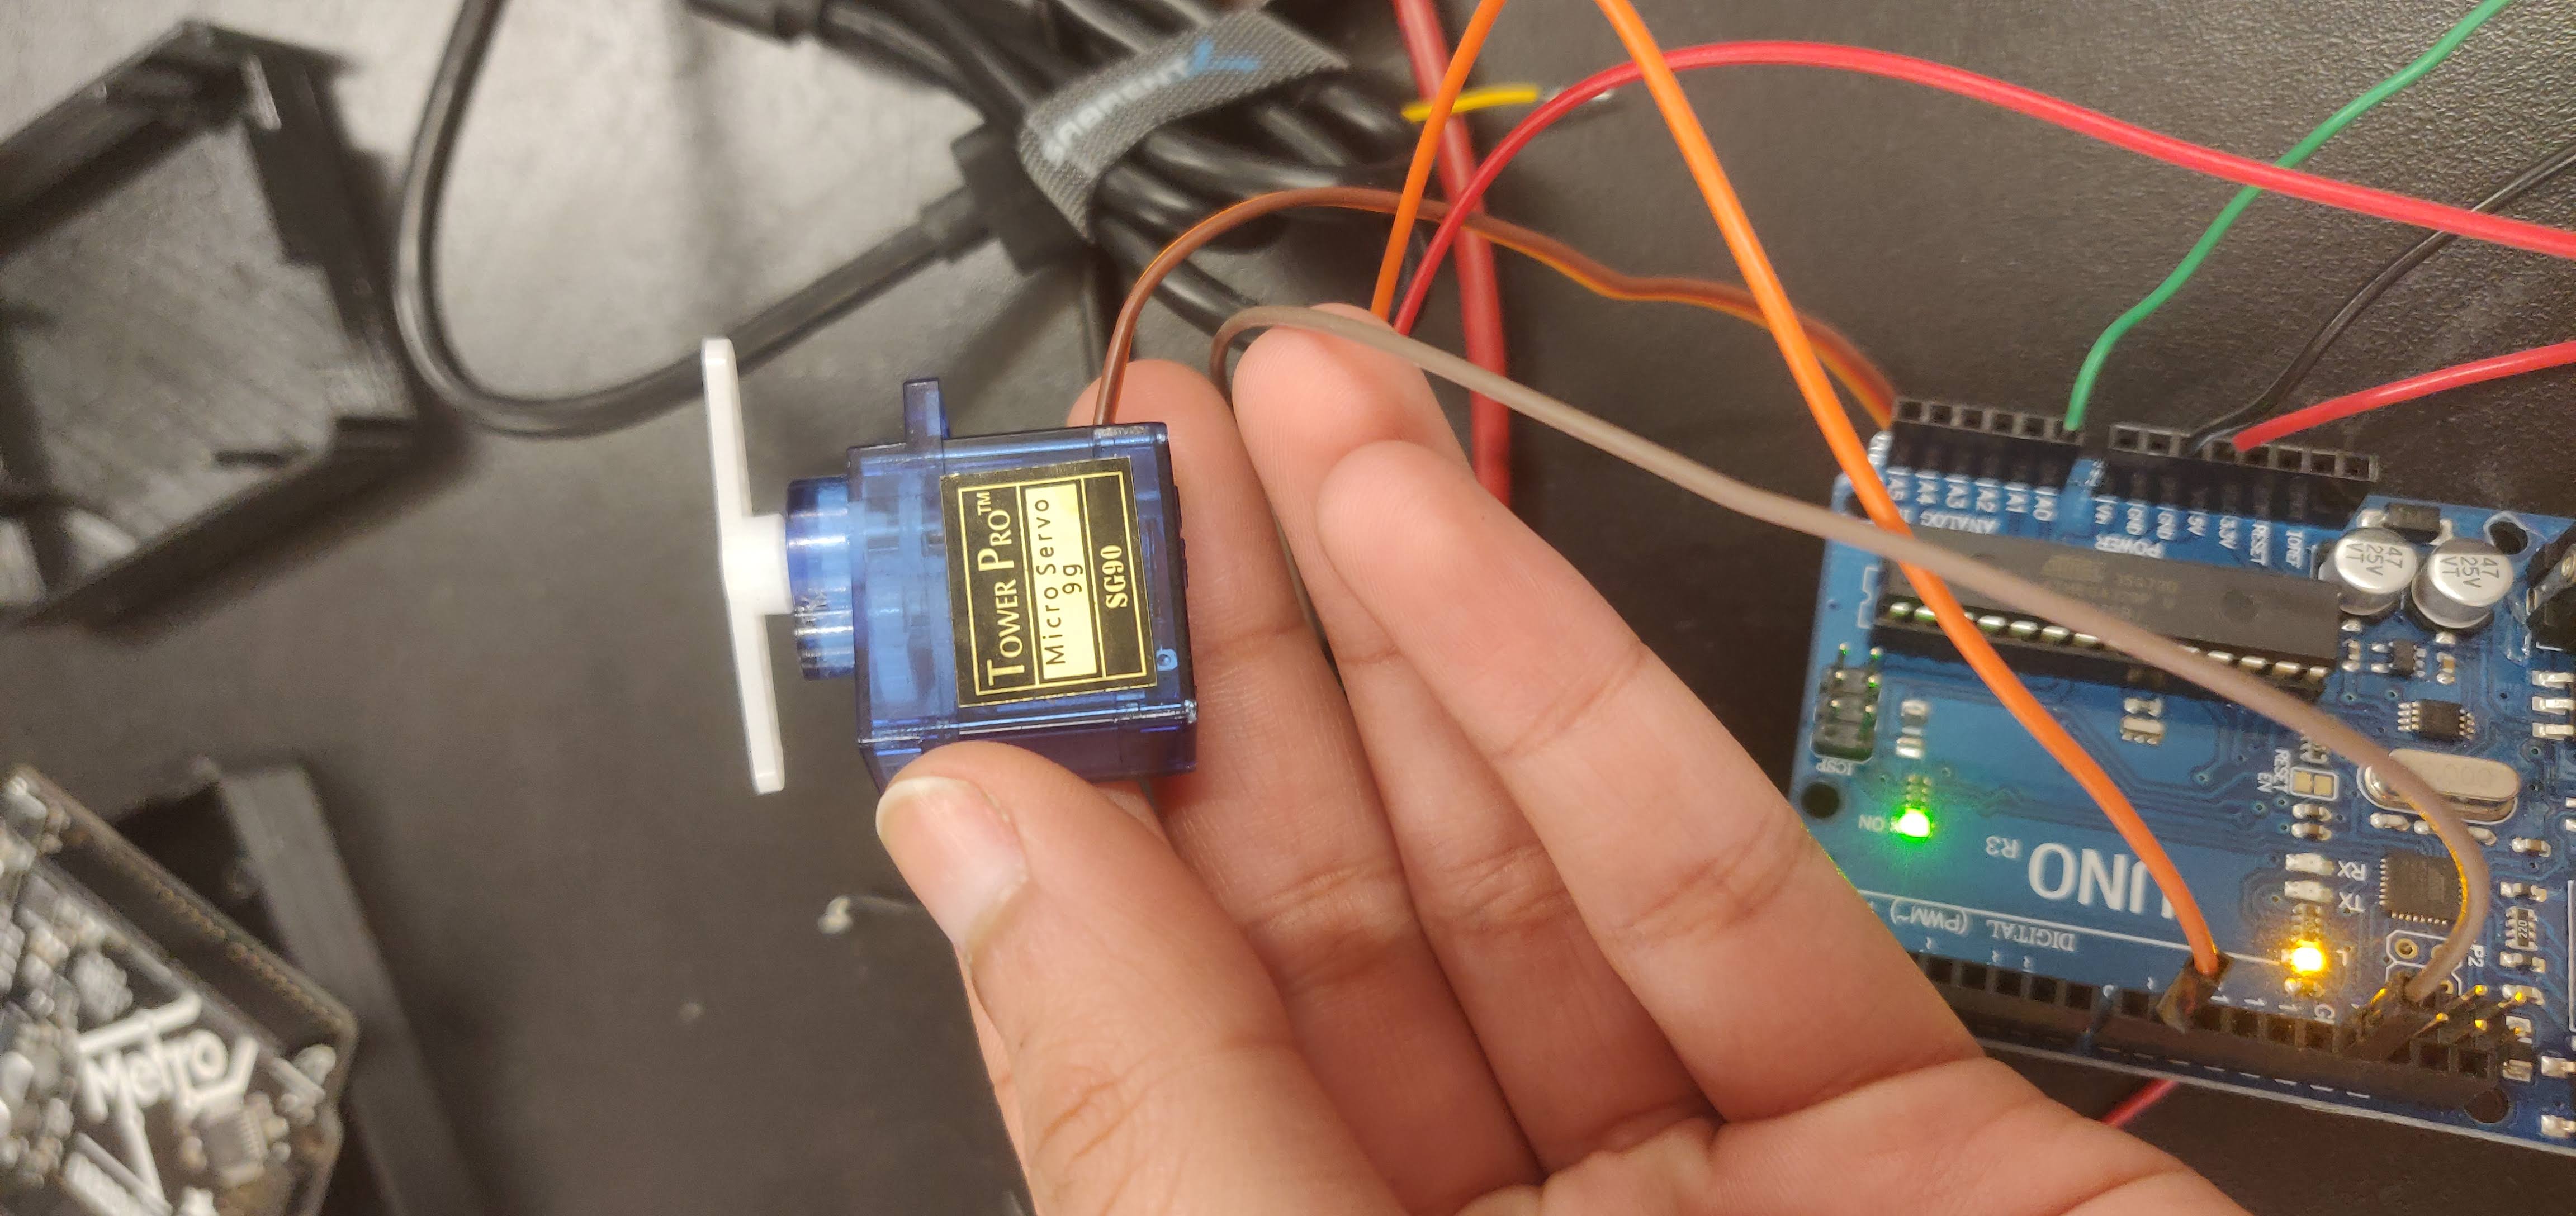
As always, I love to make things move. Be it as simple as a motor or an entire skateboard (progress is being made!). For the second part of the assignment, I decided to use a piezoelectric to make a servo rotate a certain amount of degrees.
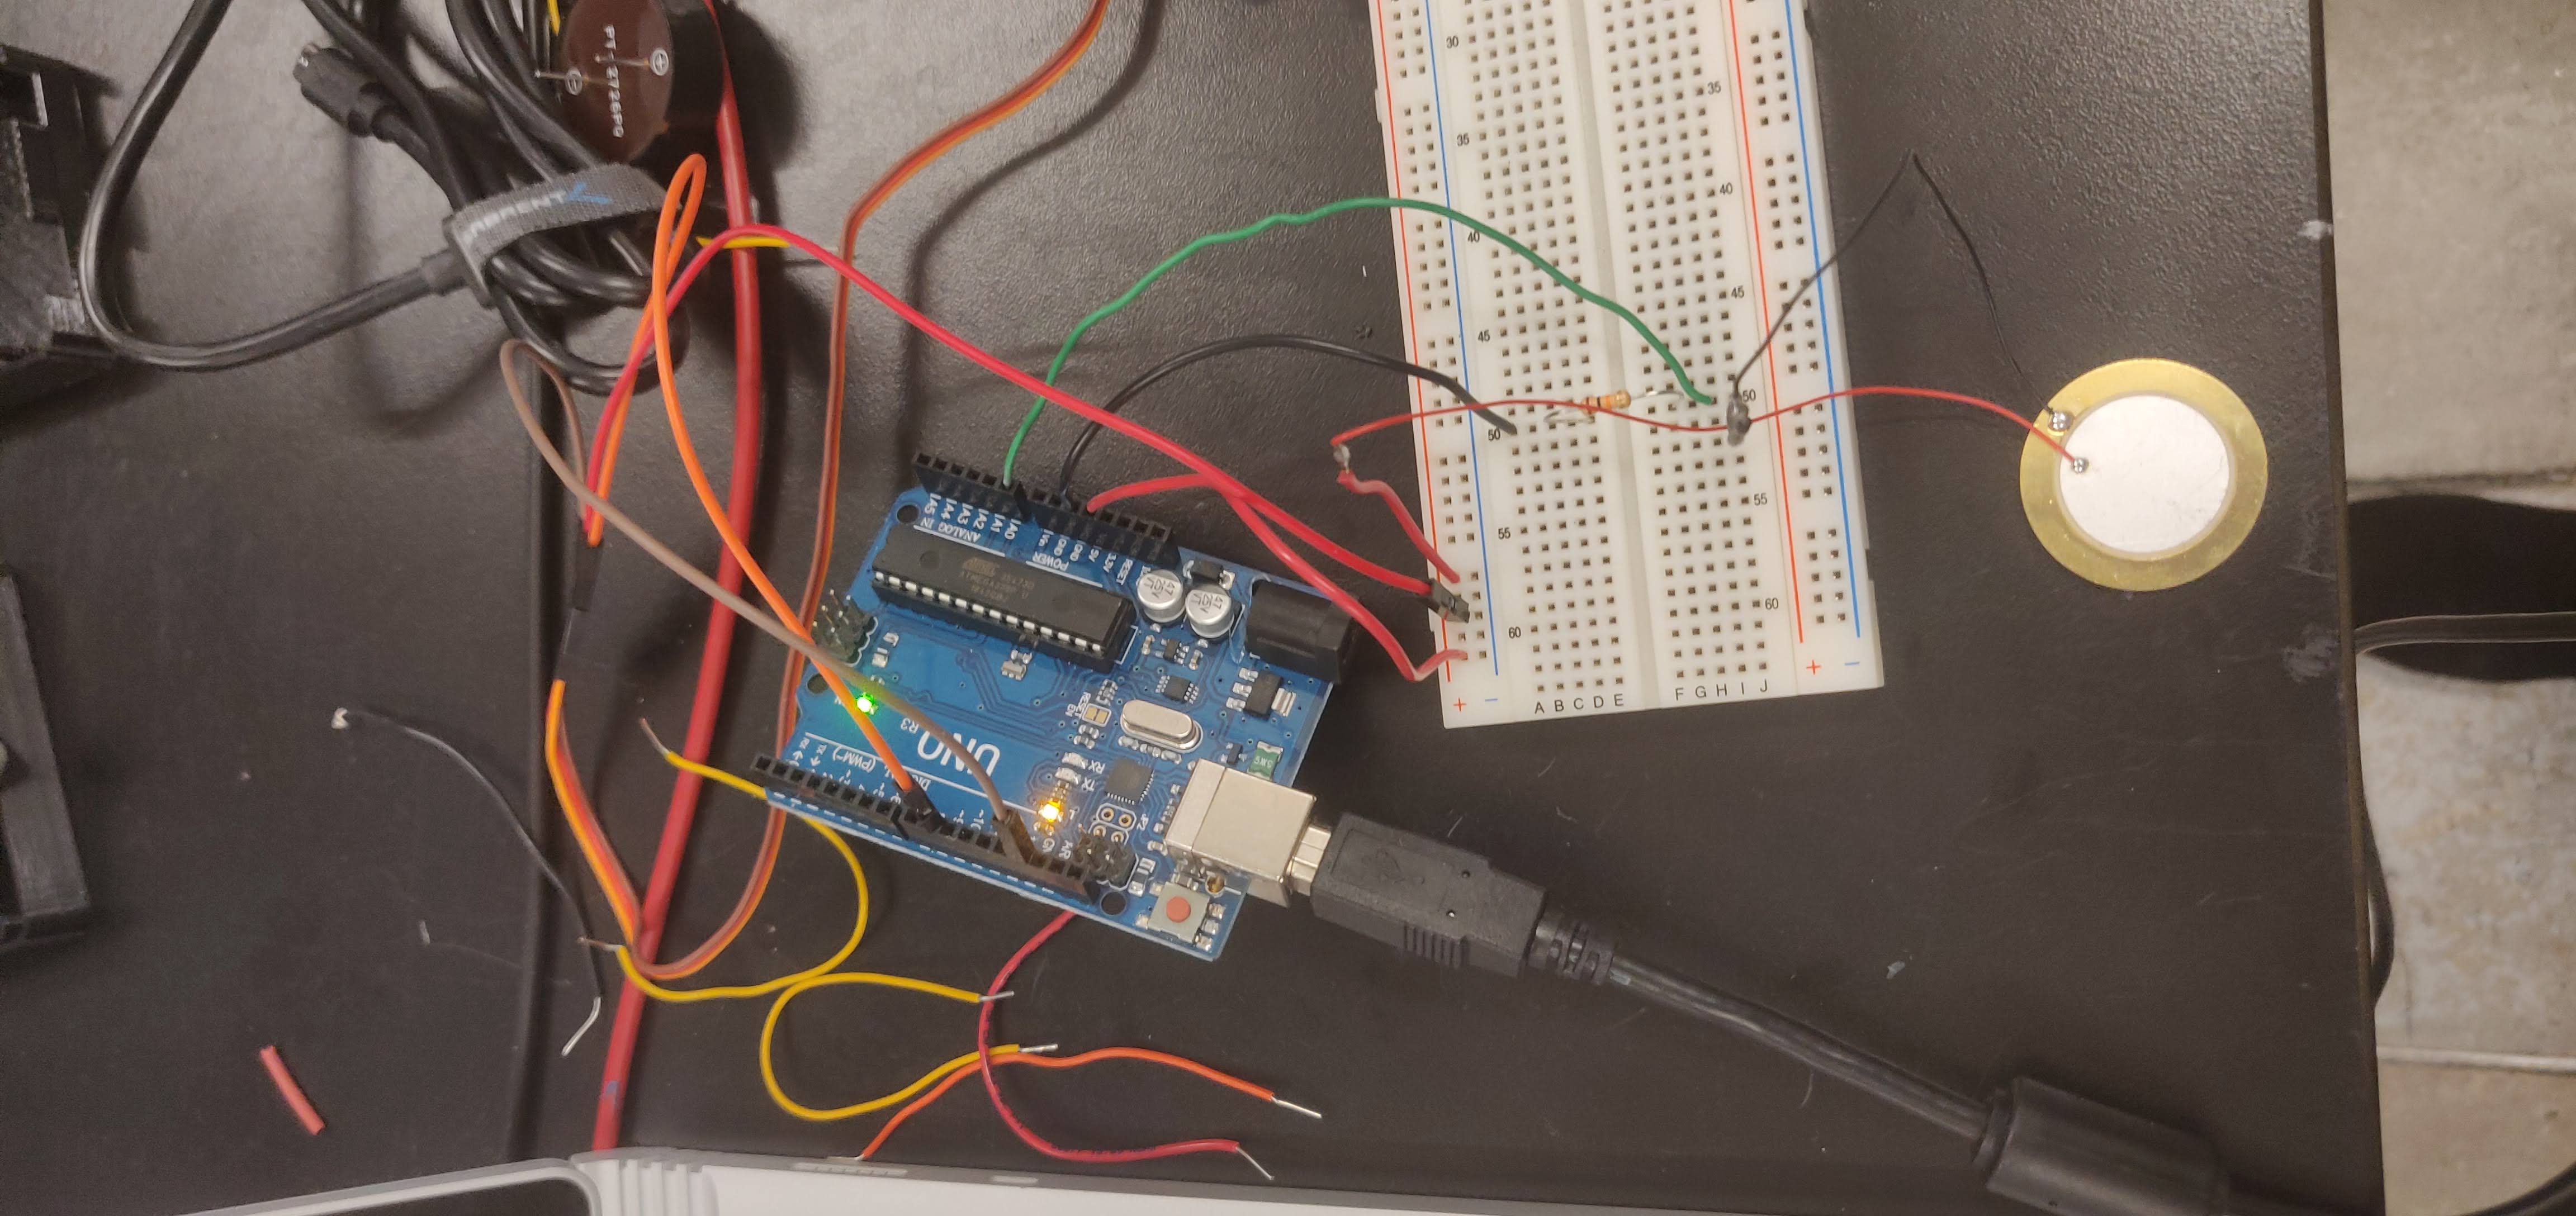
The wiring was pretty simple; the pieze came with a power and ground wire attached so I simply soldered thicker wires that could easily be inserted into the breadboard. I connected one of the pins into power wells of the breadboard (after powering with the breadboard) and used a 10 kilohm resistor to prevent frying up the piezo with too much voltage. Using simple conditional statements, I was able to configure the servo to rotate certain amount of degrees based on the senor values obtained. The values started out low and went up to over 60 so I made three conditions, one for when the sensor values were less than 20, one for values between 20 and 60 and one for above 60. The higher the sensor values, the higher degree the servo would rotate as can be seen in the video.
The output values of the piezoelectric can be seen in the plotter below. As usualy there was plenty of noise picked up the sensor and it mostly likely had to do with the sensitivity of the plates of the piezo and the amount of initial force being produced for calibration.